Exploring activity of shared directories visually.
The concept Data Resonance Imaging tries to combine an alternative representation of a Google Drive file
directory with the information richness of chat messages. The resulting symbiosis of file information,
file activity and keywords within a project’s chat history creates an entanglement of activities and reflections
– a resonance. The DRI model is able to target specific points in time within the file directory as well as in
the chat history and to examine them.
| From pen to pixel
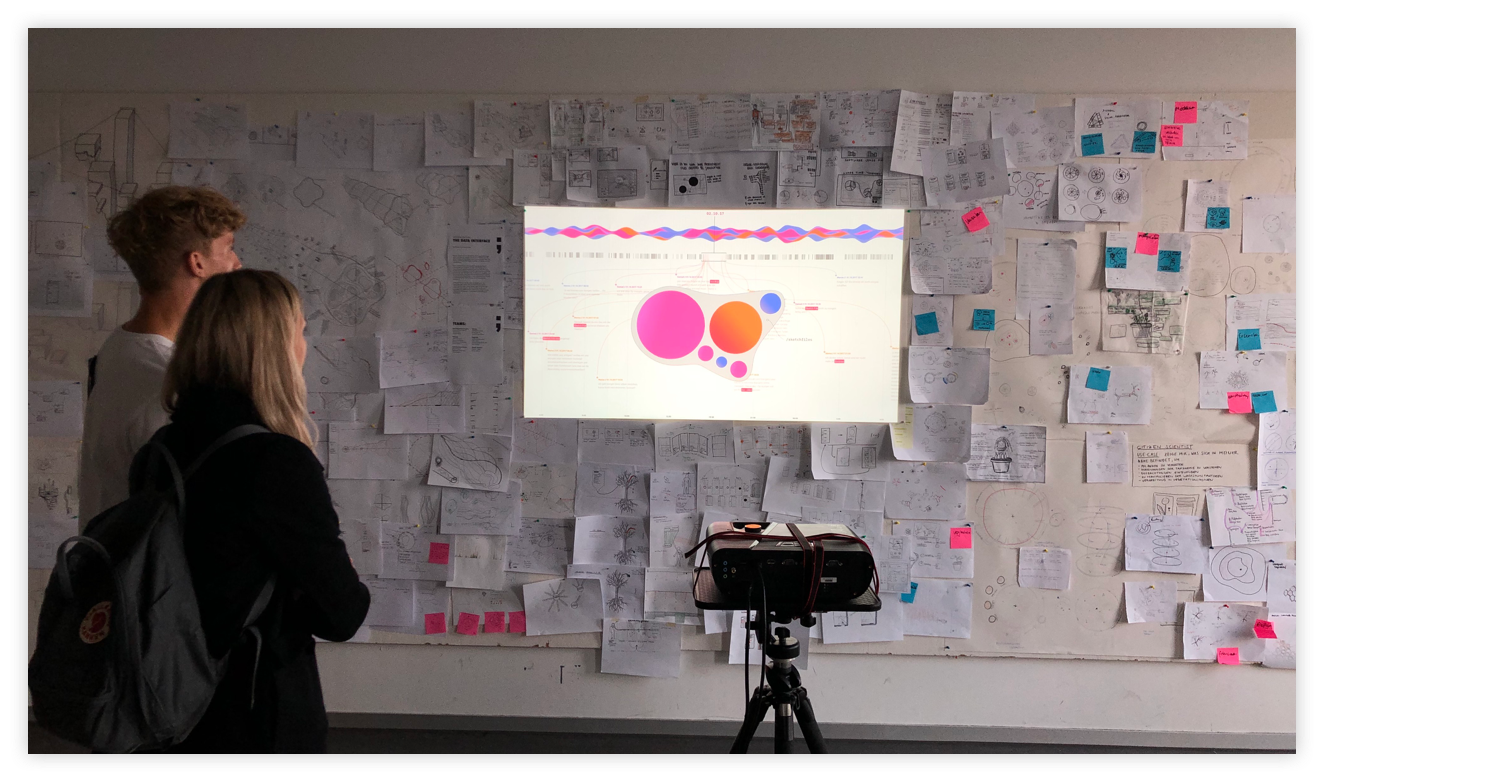
Starting from scratch without any design software, we were encouraged to develop our own design language and
operationalization. This resulted in an unusual 3D directory visualization. The experimental approach also influenced
our ideas on interaction. We envisioned a visual journey through time – directly manipulated by touch gestures.
This way allowing the user to investigate the relationship of directory layers and the chat process.
Visualizing our interface with pen and paper first left us free from any technical restrictions.
| Screen Adaption
For the first screen designs, we were faced with the challenge of capturing our paper-and-pencil vision with the
digital tools we are familiar with. Especially the 3D representation, the materiality of the stream and the arrangement
of the interaction elements in the room caused us headaches. Every now and then we caught ourselves pulling up some
rectangles with the old reflex in order to accommodate the elements in the usual UI manner.
First attempt to digitalize the sketch.
| Real Data vs Flow Data
At the first check-in presentation we had quite a blockade. We had become so accustomed to the first visual impact and got so
lost in the semantic subtleties of our activity logic that, despite intensive work sessions, we couldn't really push forward.
The breakthrough came with the focus on the lateral and frontal view of the stream. We wrote a little Python script to format
our drives meta data into activity parameters that would allow us to quick-draw the appropriate streamgraph with the online
visualization tool “RAW-Graph”. This in return provided us with SVG data we could easily process further in Sketch.
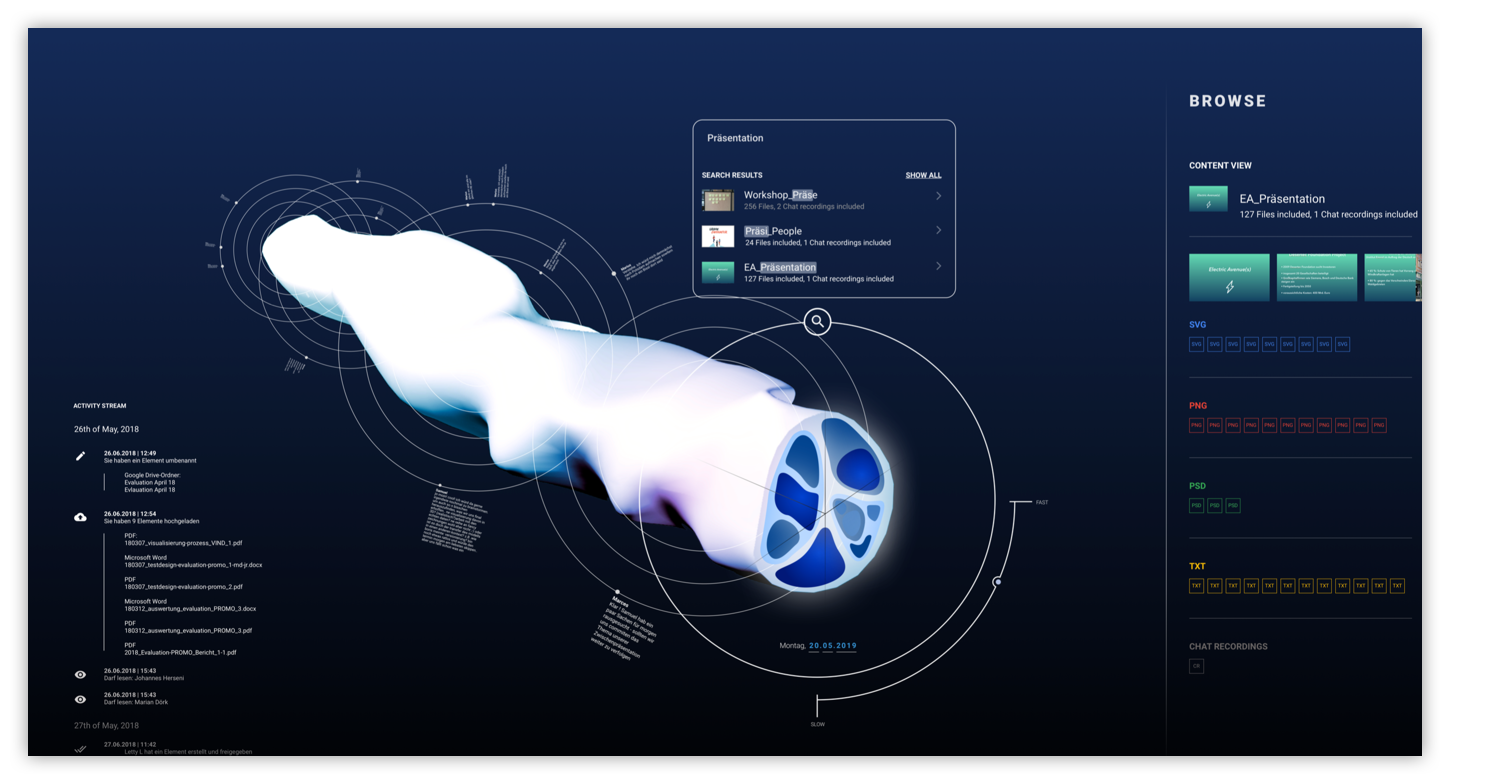
| 2D Breakdown
Based on our selfmade data set and the resulting streamgraph formations, we were finally able to cast our vision into a digital design.
The central element is and remains the activity stream along with the chat history. The elements are timed and interlocked so that the
manipulation of a single element always directly affects the other elements. For example, when moving a chat message makes older messages
appear, and both views of the stream synchronize in parallel. The interaction thus follows the rules of direct manipulation. Everything
can be touched and changed according to expectations.
| Animation · video prototype
The last iteration of our screens was created during the transfer into a video prototype by an exemplary user flow. We used animation to
characterize the behavior of elements and subconsciously communicate how to deal with them. For example, by animating the stream so it
slides sideways into the screen — establishing the axis of movement on which it later can be operated.
 Visualizing our interface with pen and paper first left us free from any technical restrictions.
 First attempt to digitalize the sketch.